Table of Contents
Introduction
Search Engine Optimization (SEO) is a crucial element for websites. Optimized websites have a good probability of ranking high against a keyword in search engines. An important part of SEO is the website’s loading time on a user’s browser. To take care of the speed aspect, we need to first find a tool that can help us with the present speed analysis. We can then further work on limitations or issues identified by that speed test tool. For most website owners, the GTmetrix speed test is a reliable way to test their website speed.
Website load time is important for Domain Authority, search engine rankings, and user experience. The lesser the load time, the higher are the chances of your website ranking well as part of the organic search. The load times between 0-3 seconds are ideal. The speed above 3 seconds can drastically impact your website’s and webpages ranking.
The lesser the page load time, the better the probability of website’s ranking on search engines. Why so? Simple, if the page load time is high, the higher the chances that the user will revert to the search results than going ahead and waiting for your website’s page load.
High page load time means a high bounce rate. Low page load time means better user experience and more visitors, which ultimately means more subscribers and more revenue.
Statistics
Let us look at some of the statistics.
Several surveys and numbers crunching have been in place relating to what should be the ideal page load speed. As already highlighted above, currently, 3 seconds benchmark is good to go. Google too follows this benchmark.
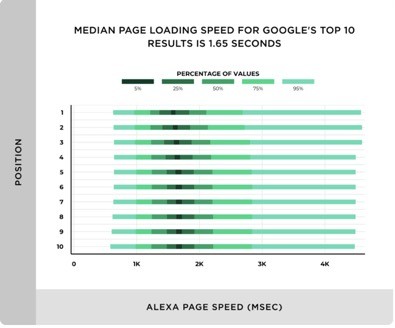
In a survey conducted by Backlinko, they tried to find a correlation between the page speed and google rankings, but couldn’t find a definite one. Though, one important thing they noted was that the pages part of Google’s first page results loaded in approximately 1.65 seconds on average.
When we talk about Bounce Rate, it increases as the page load time increases. Following are some statistics:
| Page Load Time (seconds) | Bounce Rate |
| 1-3 | 32% |
| 1-5 | 90% |
| 1-6 | 106% |
| 1-10 | 123% |
Table 1 – Statistics of the relationship between Page Load Time and Bounce Rate
As per the above table, we can see how quickly the Bounce Rate increases even if there is only a second delay.
In another survey, 85% of the websites had a landing page load time above 5 seconds. And only 2% of websites had a landing page load time under 3 seconds.
One more analysis showed that the average page speed index of websites in different sectors (Automotive, Consumer Goods, Finance, Health Care, etc.) comes out to be way higher than 3 seconds. So, every industry is lacking on this front.
GTmetrix Speed Test
Introduction
The facts stated till now show that page load speeds have a significant role to play if we want to have a good SEO score and reachability. The crux is the same – the lower the page load time, the better the user attraction and retention. The landing page loading should be as fast as possible because your business thrives due to that page.
When we talk about testing website speed and performance, the first thing that comes to mind is the GTmetrix speed test. It is one of the most popular platforms that enables you to test your website from different perspectives (speed, request flows, page size, etc.) and different cities around the world. The options available in GTmetrix for testing are very robust. You can easily get an E2E view of how your webpage is performing in the areas of speed, size, etc.
The following are some of the free options available as part of the GTmetrix speed test that users can use to test their website:
| Cities | Speed | Browser |
| Mumbai, India | Broadband Fast | Chrome – Desktop |
| Sydney, Australia | Broadband | Firefox – Desktop |
| Sao Paulo, Brazil | Broadband Slow | |
| Vancouver, Canada | LTE Mobile | |
| Dallas, USA (Old) San Antonio, Texas, USA (New) | 3G | |
| Hong Kong, China | 2G | |
| London, UK | 56K Dialup |
Table 2 – Options in GTmetrix speed test
Note: In the updated table, San Antonio, Texas (USA) is the new location for testing speed.
Let’s check out some of the GTmetrix features that are available as part of the speed test. Here, we have compiled both the new and old features so that you get an idea of what was there earlier and what has changed now.
GTmetrix speed test features (Old)
The following image shows the sample summary after a GTmetrix speed test output.
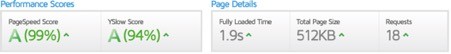
Performance Scores
As seen in the image above, the Performance Scores consist of two sub-scores – PageSpeed Score and YSlow Score. These two scores derive from some predefined conditions and the output score is out of 100%.
As a website owner, you do not have to aim for a 100% score. No matter how much you try to optimize, the output will always contain some recommendations. It is better to act only on the inputs that you find are important and feasible to implement.
PageSpeed Score
When we run the performance report on a URL, we get several tabs as part of the GTmetrix report – PageSpeed, YSlow, Waterfall, Timings, Video, and History.
Let us first focus on the PageSpeed tab which ultimately drives the PageSpeed score.
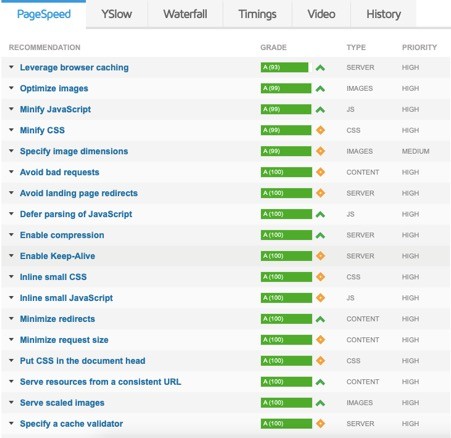
PageSpeed tab has many options which derive the final PageSpeed score. We will talk about the general and the most important options here. The following image shows the conditions part of the PageSpeed tab.
Inline Small JavaScript
Tells that JavaScript (JS) can be added within the HTML tags and rendered using HTML requests rather than rendering the whole JS file separately as it will increase the load time.
We can use a free plugin like “Autoptimize” for the Inline JS.
Defer parsing of JavaScript
JS is render-blocking. This means JS can prevent the web pages from getting displayed until JS is downloaded and processed by the browser. The defer attribute tells the browser to delay the downloading of the unwanted resources and ultimately the processing of unwanted JS. This will decrease the load time as the request would not have to wait for unnecessary JS parsing and execution.
Again, we can use a free plugin like “Autoptimize” for this.
Enable compression
If you want to work on page load speed, this is another important feature to take care of. Enabling compression of files (from the server) reduces the response/load times significantly. If the size of the resources is small, the lesser the time it would take for the resources to reach the browser.
As per GTmetrix, the pages can be reduced by 70% while using compression.
Minify CSS and JavaScript
By minifying, we are explicitly asking for the CSS and JS resources compression.
Optimize Images
Almost all the websites in the world today use images. While Images make the content more attractive, the size of the images should be as small as possible for fetching and sending to the user’s browser quickly. When we want to save each second, even a 1 MB image is too large.
The research has shown that images within 100 KB make a big difference in loading times. I know it is a lot to ask for, but that is a fact.
The task is also not impossible. We now have many tools available to compress the images. CompressNow is an online image compressing website that we can use. There are also websites like FreeImages, Pixabay, etc. that provide the option to download different sizes of the same image.
Optimized images can really reduce page load times. As per GTmetrix, compressing, and optimizing the images can reduce the load time by 80%. If your content does not necessarily require an image with fine details, go for the lossy compression. There are plenty of tools/plugins that can compress the images on your website. Plugins like Imagify and Smush are the big guns in the WordPress world.
YSlow Score
YSlow is a tool that analyses the website speed based on some parameters and offers the corresponding recommendations.
Similar to the PageSpeed tab, the YSlow tab shows all the testing conditions and values corresponding to each category. YSlow tab features help in deriving the YSlow Score.
Let us discuss some of the important conditions.
Make Fewer HTTP Requests
The condition states that the lesser the HTTP requests, the better. The core idea is to combine HTTP, CSS, and JS requests wherever possible so that minimal requests originate from the browser to the server. Reduced requests mean less load on the server and also better page load times.
Minify JavaScript and CSS
This is the same thing that we discussed earlier. We should reduce the size of JS and CSS files that may otherwise contain repeated and unwanted data (like whitespaces, etc.)
Use Content Delivery Network (CDN)
The more is the distance of the webserver from the user accessing it, the more is the loading time.
CDN helps website owners to deploy their website’s content across the globe so that their website is accessible within an acceptable time from anywhere around the world. Suppose your website is deployed in Tokyo, Japan, and your friend tries to access it from the US. Without CDN, it may take a few seconds or ages for the website to load at his/her end, which for sure will impact the user experience.
Therefore, integrating the website with a CDN is crucial. CDN helps in caching the website’s data in the CDN service provider’s data centers so that whenever a request comes, it is routed to the data center closest to the client’s location and the page is rendered from there.
Let us say that our CDN service provider has a data center in Los Angeles, California. When a request is made from the US by your friend, it won’t go to the source server in Tokyo but will be routed to the Los Angeles data center, and the page will be rendered from the LA data center only.
Add Expires headers
Adding Expires header in the request will enable the browsers to decide if they should cache a particular resource or not, and for how long. Caching resources is a good idea when you have lots of static resources on your web pages. Caching will make sure that there are fewer HTTP requests and resources rendered from the browser cache. This will also prevent unnecessary loading of the webserver.
Page Details
These are generic details about the page as part of the Performance Report. It consists of Fully Loaded Time, Total Page Size, and the number of Requests.
The Onload time is the time taken until all the resources (CSS, Images, etc.) of the page are downloaded. For GTmetrix, it was the endpoint of the test earlier. A drawback realized later was that due to variations in the network, there was a delay in the proper loading of some resources which lead to inconsistent load times.
As a solution, GTmetrix came up with the concept of Fully loaded time where GTmetrix waits for at least 2 seconds to ensure there is no network activity and then furnishes the report.
Total Page Size and number of Requests are pretty straightforward features to understand.
Timings
The timings tab helps identify the crucial events while rendering a page. It gives a view of what specific action gets initiated and at what time.
- Redirect – Captures the time if the URL is redirected to another URL. The URLs may be redirected for several reasons. Ideally, it is good to avoid redirection.
- Connect – The time taken to connect to the webserver. It also contains DNS query time and any blocked time. This time is usually high in case there is no CDN.
- Backend – The time it takes for the server to generate a response for the request.
- Time to First Byte (TTFB) – The total waiting time after which a response is captured. It is the addition of Redirect, Connect, and Backend times.
- DOM int – DOM interactive time is the time when the browser parses the HTML and creates DOM.
- First Paint – The time when the browser starts to render the page. So, even if a resource of the page is rendered, that would be the start and called First Paint time.
- Contentful paint – The time it takes to start rendering the actual contents of the page.
- DOM loaded – Point at which DOM is ready and there is no blocking of the JS execution due to CSS, etc.
- Onload – When all the processing of the page is completed and all the resources are downloaded.
New GTmetrix speed test features
GTmetrix has introduced Lighthouse-based monitoring of web pages in their new edition. The new GTmetrix speed test features do not have Performance Scores and Page Details.
Here’s what has changed:

GTMetrix Grade
The property identifies the holistic page performance of the web page in question. It focuses on page loading speeds and other performance parameters.
The GTmetrix Grade has two categories of scores i.e. Performance and Structure. Both these are calculated based on some pre-defined conditions.
Both these scores have different tabs available for the users to check the holistic results of the test. Let’s take a look at what these values represent.
Performance
The performance score is the Lighthouse performance score of a web page based on GTmetrix’s analytics, hardware specifications, browser chosen, and customized audit parameters.
The Performance score is derived out of many conditions like – First Contentful Paint, Time to Interactive, Speed Index, and more. We will briefly dive into each of the categories and understand what they mean.
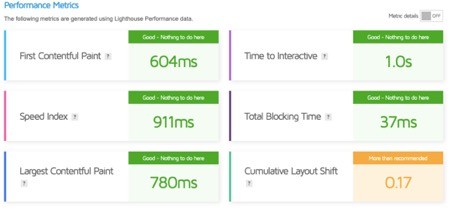
First Contentful Paint (FCP)
This metric determines how much time is taken for the initial images or text to be available/painted on the page. The recommended time is 0.9 seconds or less. This metric is important considering that waiting time will create issues. A large time may increase the bounce rate.
Time to Interactive (TTI)
Time to Interactive tells how much time it takes for a webpage to become completely interactive i.e. when the user can perform any action on the page. For a good user experience, the TTI should be 2.5 seconds or less.
Speed Index (SI)
There is a time calculated from the time when the web page request is made and when the content of the visible part of the page is displayed. This average time is the Speed Index of a web page. The recommended time is 1.3 seconds or less.
Total Blocking Time (TBT)
The java scripts and other scripts take time to execute. There is a blocking time involved during which the scripts are loaded and executed.
Total Blocking Time (TBT): The web page loading blocks for this time. The recommended value is 150 milliseconds or less.
Largest Contentful Paint (LCP)
It is the time taken by the largest content of the page to be loaded/painted on the web page. This generally relates to the primary image or largest text block on the web page. The ideal LCP time should be 1.2 seconds or less.
Cumulative Layout Shift (CLS)
CLS is the unusual shifting of elements on the web page when the page is still loading. This is annoying when the user is trying to interact with the page and suddenly the elements move. These elements could be text, image, video, fonts, etc. The ideal value that GTmetrix recommends for CLS is 0.1 seconds or less.
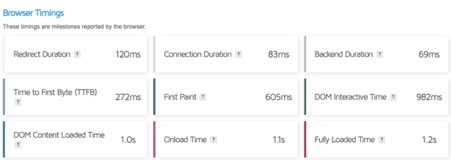
The Browser Timings are self-explanatory. Check out GTmetrix for more information. Still, I would like to focus on two properties:
DOM Interactive Time
This is the time taken when the browser stops processing the HTML (and scripts) and DOM (Document Object Model).
A web browser converts a webpage into DOM and its elements. The DOM helps the browser in understanding the accessibility and manipulation of HTML pages. Developers can help to extract the different elements of the page using DOM.
DOM Content Loaded Time
This is the time when DOM for the HTML is built by the browser and there are no images, stylesheets, etc. to load. This means that the time only relates to HTML processing and not external resources like images and stylesheets.
Structure
The other category under GTmetrix Grade is Structure. The score is the assessment of lighthouse and custom GTmetrix audits.
Here is a sample screenshot of the metrics that form a part of the score:
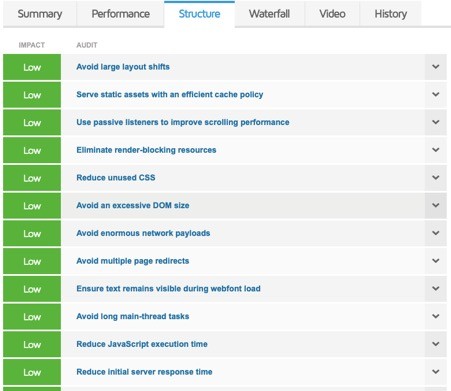
Let’s check out some of the audit parameters and what they represent.
Avoid large layout shifts
The parameter represents the movement of page elements (buttons, text, links, etc.) when the page is still loading. A high layout shift could be bad for the user experience because it delays user interaction with the web page.
Serve static assets with an efficient cache policy
Static assets are those that don’t change over time. They remain unchanged as part of the process. This parameter focuses on static elements and their loading times. Ideally, a static asset should be cached so that it can be loaded quickly from a cached memory rather than from the source server where it is processed every time and returned.
Use passive listeners to improve scrolling performance
The browsers block page scrolling during the loading of the page (including scripts execution). This scrolling block hurts the user experience where a user thinks that particular elements are non-interactive. Adding passive listeners can tell a browser to enable scrolling even when the page is being loaded. This is done by adding passive: true to the different event listeners like scroll event listeners, pointer event listeners, touch event listeners, and wheel event listeners.
Eliminate render-blocking resources
This parameter tells if any JS or CSS is blocking the FCP. Loading the crucial JS and CSS inline and differing all the non-crucial JS/CSS to a later time is a good activity. Different plugins come with fulfilling this feature.
Avoid enormous network payloads
Network payloads like fonts, images, CSS, etc. can cost network bandwidth and also bad user experience. Large payloads take a huge time to load and thus affecting user interaction.
Avoid multiple page redirects
Page redirects can lead to large loading times. A redirect is a process where a web page is redirected to another page when a request to the page is sent. Multiple redirects can increase the loading time of the actual page. It is recommended to have no redirect or minimum redirect if necessary. More than 2 redirects are considered bad.
Ensure text remains visible during Webfont load
The parameter checks if the text on the page is visible when the web fonts are getting loaded. Often, when web fonts are getting loaded, the text is invisible. In such a case it is advisable to load the system default fonts. This can be done by marking the value of font-display: swap in @font-face style.
Reduce initial server response time
The response time of the primary HTML document should be as minimum as possible because other requests are dependent on it. This can be achieved by using a light page and minimum or no redirects.
Other parameters are self-explanatory. Check out GTmetrix for more information.
Web Vitals
Web vitals define if your website can deliver a good experience to the user. It consists of vital metrics like LCP, TBT, and CLS which have been discussed in the previous section.
Waterfall
Another useful tab to have an in-depth analysis of website performance is the Waterfall tab. The tab contains the information of all the requests required to render a page. It has all the request-response headers for each request.
If you want to have an idea of how much time a request is taking,? Header values are correct or not,? What is the size of the request,? etc. the Waterfall tab will come to the rescue. Following is the sample of the Waterfall tab.
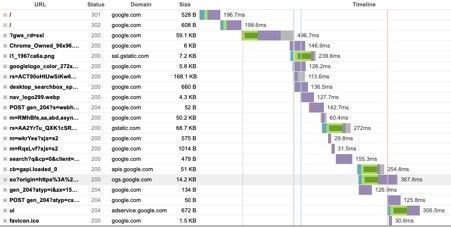
Every row has data related to different request times (Blocking, DNS Lookup, Connecting, SSL, Request sent, Waiting time, and Response) and features like FCP, LCP, TTI, DOM loaded, etc.
The tab also has a feature to filter out requests based om HTML, JS, CSS, Fonts, Images, etc.
Video and History
The last two tabs are Video and History. If enabled, you can watch the video of how your page was loaded.
History provides a mapping of various parameters against the time when the request was initiated.
History provides three different views:
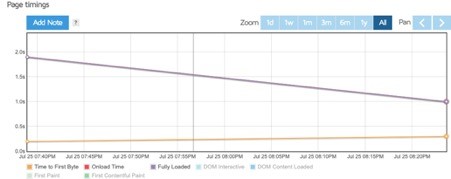
Page Timings (Old feature)
As per the Timings tab, Page Timings is the graph between the response times and the events.
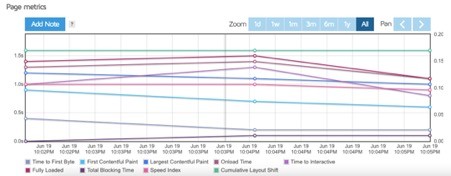
Page Metrics (New feature)
Here, you will be able to see the historical graphical representation of different metrics like LCP, FCP, TTI, TTFB, TBT, and more as part of the GTmetrix speed tests. This graph is plotted and enhanced as and when new tests are initiated from the same location.
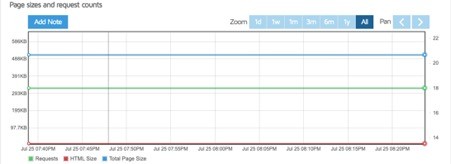
Page sizes and request counts
This graph shows if there is any change in the Page size and number of requests as per different speed tests.
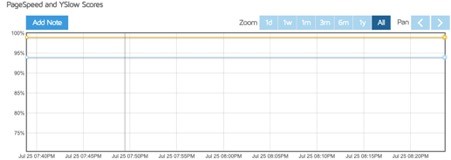
PageSpeed and YSlow Scores (Old feature)
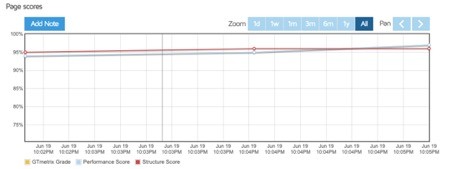
Page Scores (New feature)
This is a simple graphical representation of Performance and Structure scores.
Conclusion
This article clearly shows that the GTmetrix speed test is extremely useful to test a website’s speed and performance. Once you will dig deeper into the features GTmetrix provides, you will find a whole new world of information about your website and web pages.
Pingdom is another tool that measures the website performance and speed. For Pingdom vs GTMetrix, you can compare the features between the two as part of their blogs.
Good Reads & References
CURATED & WRITTEN BY
AYUSH PANDYA
(AUTHOR – THE UNPRECEDENTED CULT)