Table of Contents
Preface
In the previous article, we focused on GTmetrix as a tool to test the speed and performance of the website (or webpages) and established a relationship with the SEO. While GTmetrix is a good tool, there are also some other handy tools that we can use for webpage speed testing. In this article, we will focus on one such website or tool: Pingdom and will see how the Pingdom website page speed test helps in identifying any bottlenecks relating to page speed.
Introduction
Pingdom is a Sweden-based software firm that provides website speed and performance tools as Software as a Service (SaaS). SolarWinds (an American software company) now owns Pingdom. The tool apart from website page speed and performance statistics also provides many other services/features.
Pingdom Website Page Speed Test and Other Services
Pingdom is a very smooth and easy to use webtool. It offers both free and paid services. The free option works just like GTmetrix and provides website speed and performance data analysis. If you are a blogger or a small firm that doesn’t require a holistic E2E website management solution, you should give Pingdom a try. It is free of cost at least for basic speed analysis.
Pingdom provides the following Product Services:
Synthetic Monitoring, which includes:
- Uptime Monitoring: When your website goes down, it can severely hamper your business. Pingdom provides a testing feature to communicate if the website goes down at any point in time. The tool sends proactive SMS to the concerned person in such a case. The feature also provides testing of websites from different locations around the world. The feature also provides an option for RCA (Root Cause Analysis).
- Page Speed Monitoring: Pingdom offers a complete package for Page speed and performance statistics analysis. Performance Grade, Number of Requests, Load time, and Page size are some of the outputs you can see using Pingdom. It also provides information on how much time a request took (like the Waterfall tab in GTmetrix), what was the weight of the request, etc. The automated Page Speed Monitoring is available so that you can cut down on manual work.
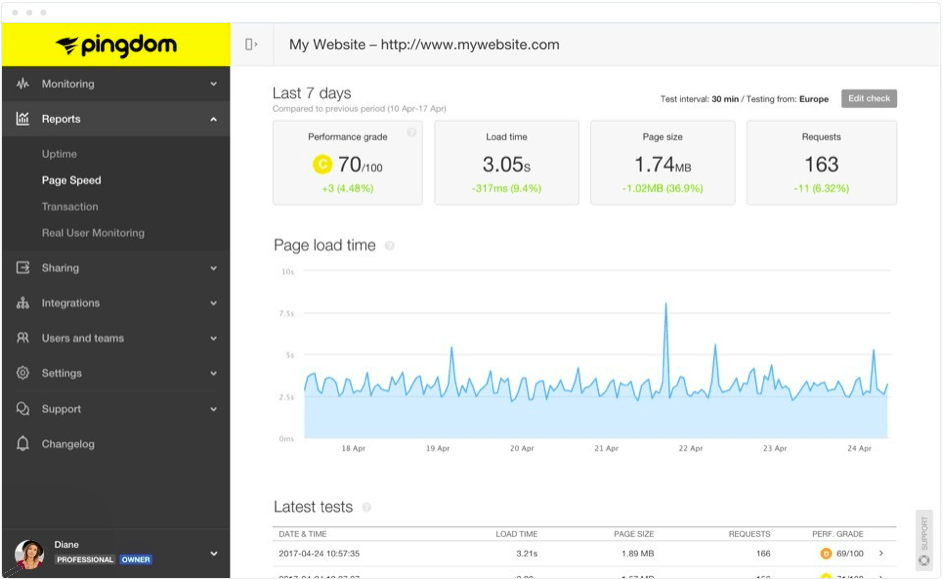
Image by www.pingdom.com
Following is the sample Waterfall graph for our website:
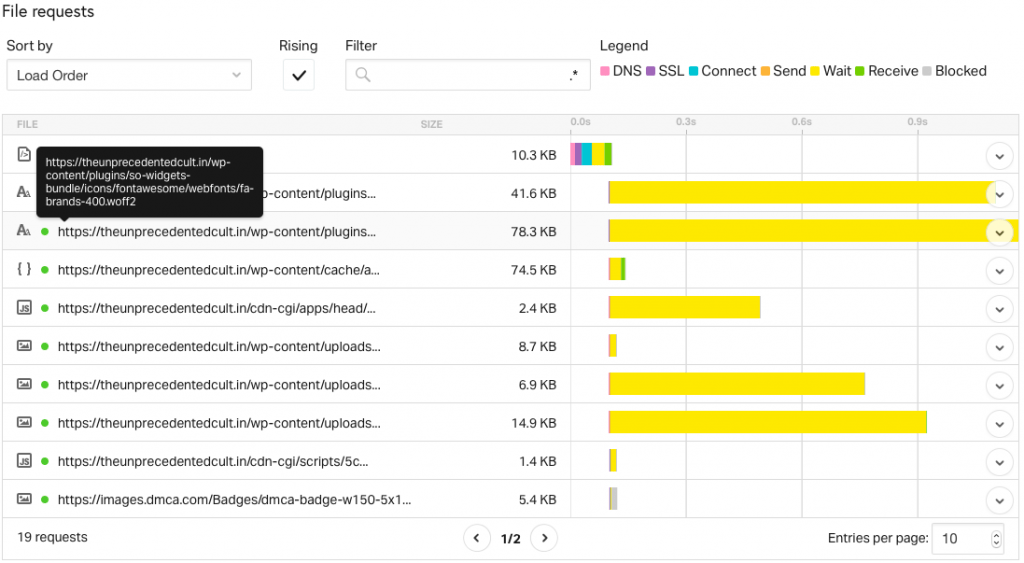
Image by www.pingdom.com
- Transaction Monitoring: This is one of the great features of Pingdom. It helps you simulate user interaction with your website just like a human user would do. Pingdom uses its separate browser at the backend and automatically executes the steps defined by you. The tool sends an auto notification in case of an issue and you can proactively take necessary action. The option to generate reports is also available as part of this feature.
- Website Status Monitor or Alerting: Based on any issue, you can define alerts and their criticality. You can also configure which users should get what alerts.
Real User Monitoring (RUM), which includes:
- Live Map: This feature furnishes the impact due to the website outage. It shows the impacted regions and also helps in the analysis of any trends of outages over time.
- User Experience Monitoring: The feature focuses on the health and performance of a website. Regular monitoring at fixed intervals allows you to be vigilant when an incident occurs. You can also set a benchmark above which you think Customers will have a satisfying experience and then monitor the website.
- Page Load Performance: The reports furnished can be beneficial to your customers to understand how their websites are working. The customers can generate easy-to-use reports using Pingdom UI.
- User Behavior Metrics: Provides different metrics reports (most visited pages, active sessions, bounce rates, etc.). These metrics can provide you with important information like what are the customer trends while visiting your website, how your website is performing, and much more.
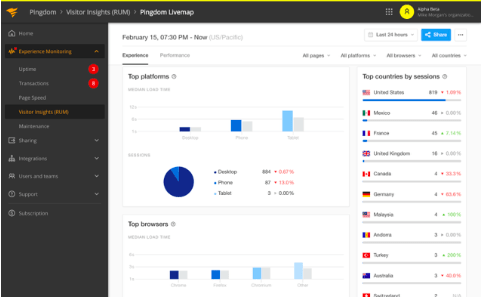
Image by www.pingdom.com
Pingdom Website Page Speed Test
Generic Options
Let us now focus on our core topic: website speed test. Pingdom website page speed test is a free service and provides you options for testing your web pages from some predefined cities across the globe. The summary report contains various outputs, Performance Grade, Page Size, Load time, and the number of requests. Here is a sample summary report.
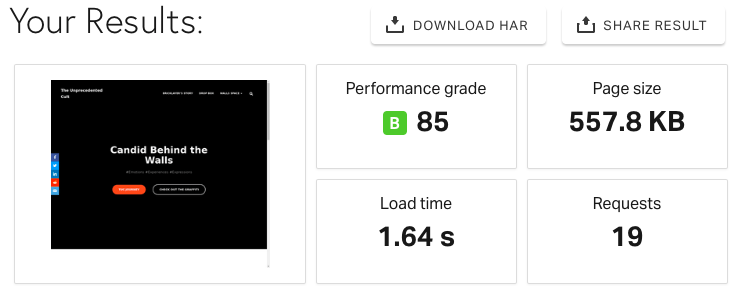
Image by www.pingdom.com
Just like GTmetrix, Pingdom allows the website speed test from seven different cities around the world and 5 continents:
- Asia –> Japan – Tokyo
- Europe –> Germany – Frankfurt
- Europe –> United Kingdom – London
- North America –> USA – San Fransisco
- North America –> USA – Washington D.C.
- Pacific –> Australia – Sydney
- South America – Brazil – São Paulo
Testing your website from different locations will help you in analyzing how your website is performing from around the world.
Let us take a look at the output sections.
Pingdom Website Page Speed Test Summary
Consider the Image above. In the image, you can see that the:
- The performance grade of our main page is 85/100.
- The page size is 557.8 KB.
- The number of requests is 19.
- The time to load is 1.20 seconds.
The stats here show a good picture of how our webpage is performing. Also, the data fetched from the cache rather than the source webserver reduces considerable time. Thus enabling cache is an important functionality.
Improve Page Performance
This section provides scores out of 100 for various rules and conditions. It might not be possible to make everything 100% perfect, but the section will help you understand the areas where your webpage is lacking.
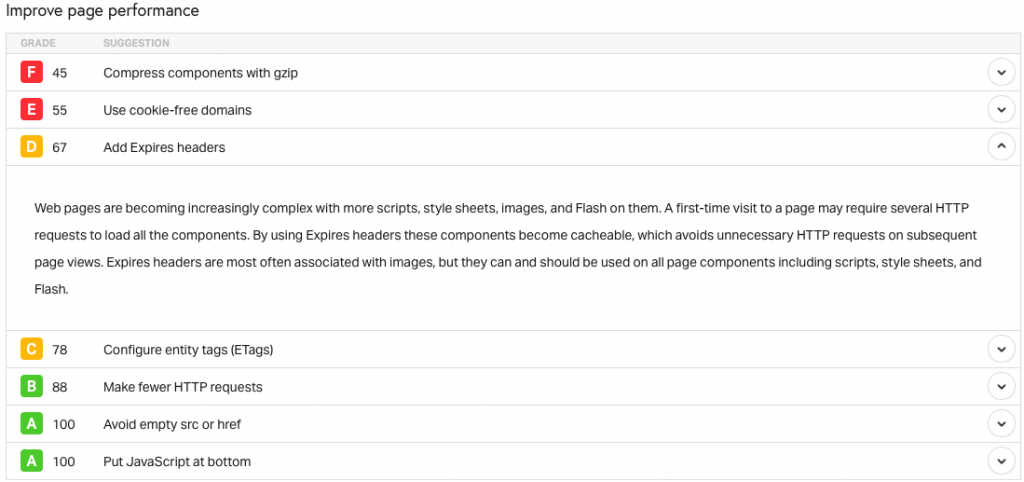
Image by www.pingdom.com
In the image above, you can see the scores in front of various conditions. The grades will give you an overview of which condition requires action. Again, it all depends on how you want to fix these conditions. There may be a scenario where fixing a particular condition may break the other condition. So, take an educated call if you want to work under such conditions.
Let us look at some of the conditions shown above and what they mean.
Add Expires Header
Expires header tells the browser how long a particular resource remains cached. Post that, the resource is fetched from the source. The functionality can be configured using a CDN or some caching plugin.
Compress components with gzip
This condition tells the web admins to enable the compress feature on the server so that when a response is sent, it is sent in a compressed form. This will greatly reduce the response time for a request. The compression will work on CSS, JS, and HTML files only. Images are excluded from this as they have a different compression mechanism. There are various WordPress plugins that can help with compression.
Use Cookie-Free domains
HTTP cookies are pieces of data or files that contain information. For example, if you logged on to www.amazon.com and searched for the wallet, the amazon server will send a cookie that will gather the surfed information and save the cookie on your computer. Next time when the same user visits Amazon’s website, he would see products related to wallets because the cookie will interact with the host server to tell it that he/she is the same person who searched for wallets the last time. The cookies thus enhance the user experience.
Cookies interaction can degrade the performance due to cookies interacting with the host server. This is where cookie-free domains come into the picture.
A cookie-free domain is a domain that does not send the request to store cookies to the user’s browser. This is helpful when we have a website with static images, CSS files, etc. that do not change often. These files do not interact with the users, so they can be sent without cookies. As a solution, a sub-domain can be set that can host all the static resources and when a request is made, static resources can be fetched from this domain without sending any cookies. Having a cookie-free domain helps reduce the load on the host server as there would not be unnecessary interaction between cookies and the webserver.
At times we can ignore this warning because with protocol HTTP/2 this is not a severe issue.
Pingdom Speed Test Response Codes

Image by www.pingdom.com
You can see in the image above a response code is available as part of the output. The sample shows that all the 19 requests went through successfully. The response codes are the HTTP codes that you would be familiar with. Some of the codes returned are:
200 OK- Everything is OK.
301 Moved Permanently- The Request resource moved permanently.
404 Not Found– The requested resource not found.
Pingdom Speed Test – Content size by content type & Requests by content type
Content size by content type displays what is the size (thus %age of overall page size) of resource/content type on a particular page.
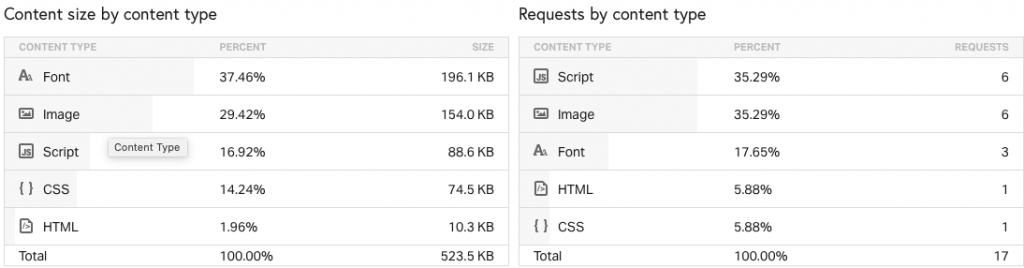
Image by www.pingdom.com
The image shows that out of the total page size of 523.5 KB, the image’s total size is 154. KB i.e. (154.0/523.5) * 100 = 29.42%
The statistics can help in identifying and optimizing a particular resource(s) as required. For optimizing images, we can first use Compressnow to compress the main image, and then further use compression-enabled plugins like Smush, Imagify, etc.
Request by content type: The output of this category consists of what types of requests and the count of those requests initiated during the page load. Thus, as per the image above, out of the total 17 requests, 6 are for Images, and so on.
Pingdom Speed Test – Content size by domain & Requests by domain
The output of these categories shows which domain cater to the different requests as part of the page loading.
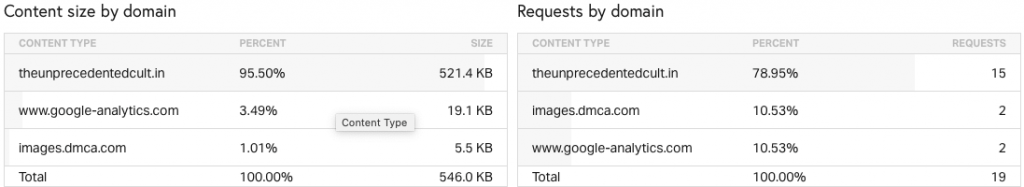
Image by www.pingdom.com
Content size by domain shows the size of the response that is rendered from a domain for a particular page. In the image above, you can see that out of a total page size of 546 KB, 521.4 KB (or 95.50%) is rendered as part of theunprecedentedcult.in domain. The rest of the requests are catered via google-analytics and DMCA domains.
Requests by domain show which domain caters to how many requests. In the image above, we can see that out of 19 requests, 15 are catered by theunprecedentedcult.in domain, while others are catered via google-analytics and DMCA domains.
Waterfall Analysis
In the end, let us look at the Waterfall output.
The waterfall graph in the Pingdom website speed test results is similar to what we see in the GTmetrix Waterfall tab. When a page is tested, the waterfall analysis contains the information of all the requests that are initiated as part of page loading, the size of each request, the time taken for the request to complete, the request and response headers, etc. Following is a sample image of Pingdom’s Waterfall Graph which shows the request and response headers for a request.
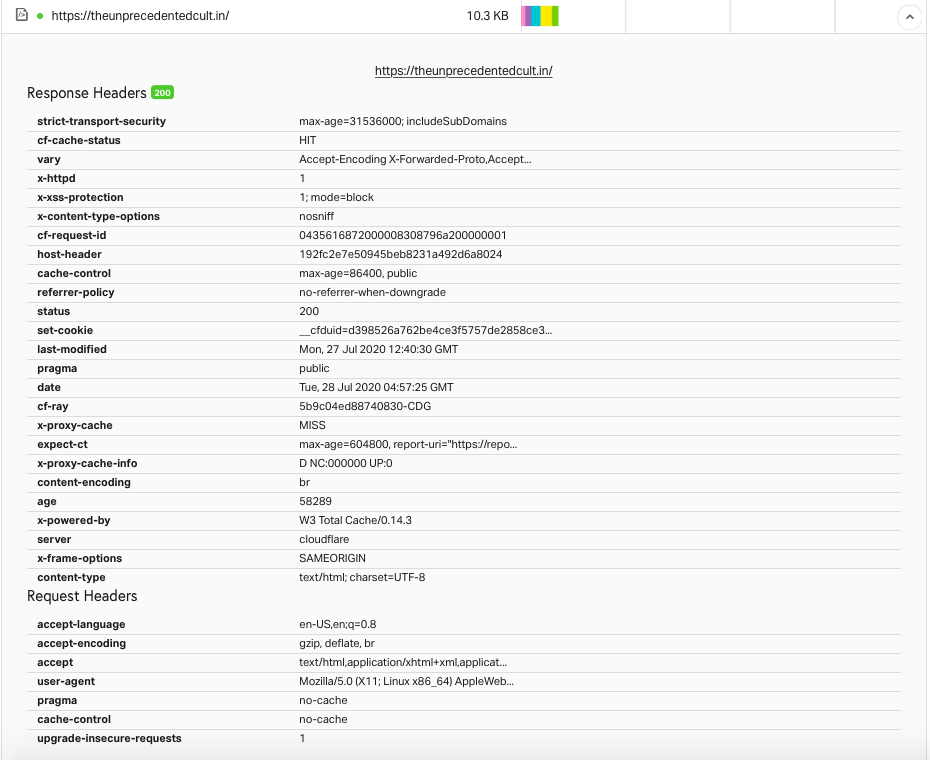
Image by www.pingdom.com
The same request and response headers can be seen on any browser and also as part of the GTmetrix Waterfall tab.
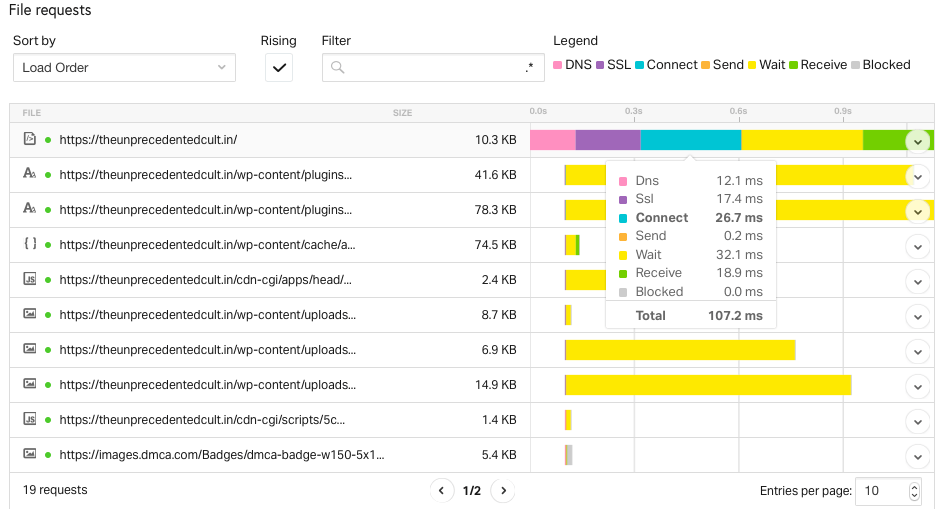
Image by www.pingdom.com
Let us see what coloring scheme is followed in the Waterfall graph. We will take the example of our Home page.
- The pink DNS color bar indicates the time the DNS resolution took as part of the HTML request. Here it is 12.1 milliseconds.
- The purple SSL color bar indicates the time it took to create an HTTPS encryption channel between the browser and the webserver.
- The blue Connect color bar indicates the time it took to connect to the webserver. This time can be huge if CDN is not used.
- The orange Send color bar shows the time it took to send a particular request to the webserver. Here Send is 0.2 milliseconds.
- The yellow Wait color bar indicates the time it took before the response was received for a particular request. This is the time between the Send and the Receive times. This time can also be related to Time to First Byte (TTFB).
- The green Receive color bar indicates the time it took to capture the full response.
- The grey Blocked color bar indicates that the browser is not yet ready to send a request as other requests are still in process.
Summary
We have made the article descriptive so that you have an idea of what all Pingdom brings to the table. We also focused on the website speed test part of the Pingdom tool. The output that Pingdom generates is quite detailed and useful. The webserver admin can take necessary precautions and corrective measures to find a solution for the high response times and unwanted requests.
I would recommend using both GTmetrix and Pingdom for the website page speed test so that you have clear visibility of how your website is performing.
Good Reads & References
- For speed test: Pingdom Website Speed Test
- For images and references: Pingdom Home
CURATED & WRITTEN BY
AYUSH PANDYA
(AUTHOR – THE UNPRECEDENTED CULT)